Wodarz, Sierro, Klenerman, 2007
Model Status
This CellML model represents the first model in the original paper (the 'core' model which describes the basic dynamics of the cytotoxic T lymphocyte infection). The model runs in OpenCell to recreate the results in the published paper. The units have been checked and they are consistent. The model also runs in COR but due to the long duration of the simulation is not ideal for use in COR.
Model Structure
ABSTRACT: Upon acute viral infection, a typical cytotoxic T lymphocyte (CTL) response is characterized by a phase of expansion and contraction after which it settles at a relatively stable memory level. Recently, experimental data from mice infected with murine cytomegalovirus (MCMV) showed different and unusual dynamics. After acute infection had resolved, some antigen specific CTL started to expand over time despite the fact that no replicative virus was detectable. This phenomenon has been termed as "CTL memory inflation". In order to examine the dynamics of this system further, we developed a mathematical model analysing the impact of innate and adaptive immune responses. According to this model, a potentially important contributor to CTL inflation is competition between the specific CTL response and an innate natural killer (NK) cell response. Inflation occurs most readily if the NK cell response is more efficient than the CTL at reducing virus load during acute infection, but thereafter maintains a chronic virus load which is sufficient to induce CTL proliferation. The model further suggests that weaker NK cell mediated protection can correlate with more pronounced CTL inflation dynamics over time. We present experimental data from mice infected with MCMV which are consistent with the theoretical predictions. This model provides valuable information and may help to explain the inflation of CMV specific CD8+T cells seen in humans as they age.
The original paper reference is cited below:
Dynamics of killer T cell inflation in viral infections, Dominik Wodarz, Sophie Sierro and Paul Klenerman, 2007, Journal of the Royal Society, Interface, volume 4, issue 14, 533-543. PubMed ID: 17251133
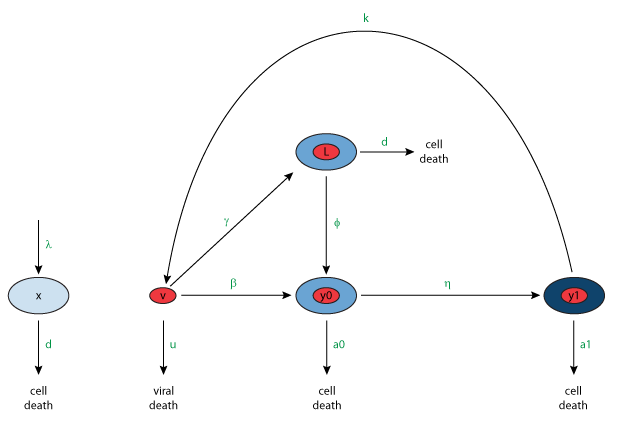 |
| Schematic diagram of the different components and variables included in the mathematical model of the dynamics of killer T cell inflation. The core model comprises five components: susceptible host cells (x), free virus particles (v), early-infected cells (y0), late-infected cells (y1), and latently-infected cells (L). When susceptible host cells become infected with virus, the product cells are either productively infected or are latently infected. Productively infected cells can be divided into two subsets; those which express early-gene products and those which express late-gene products. The latter produce new free virus particles and the replication cycle is completed. Latently infected cells are initially silent but can become activated, giving rise to more productively infected cells. |